HSC1103 - Radiobiology & Radiation Protection - Cell Survival Curves and the 5 'R's of R
- Oct 15, 2018
- 4 min read
Learning objectives:
Purpose of CS curve for mammalian cells
Sketching CS curve for mammalian cells, description of different regions
CS curve affected by:
Dose rate
LET
Oxygen
Fractionation
Position in cell cycle
LQM – Linear Quadratic Model
Five ‘R’s of Radiobiology
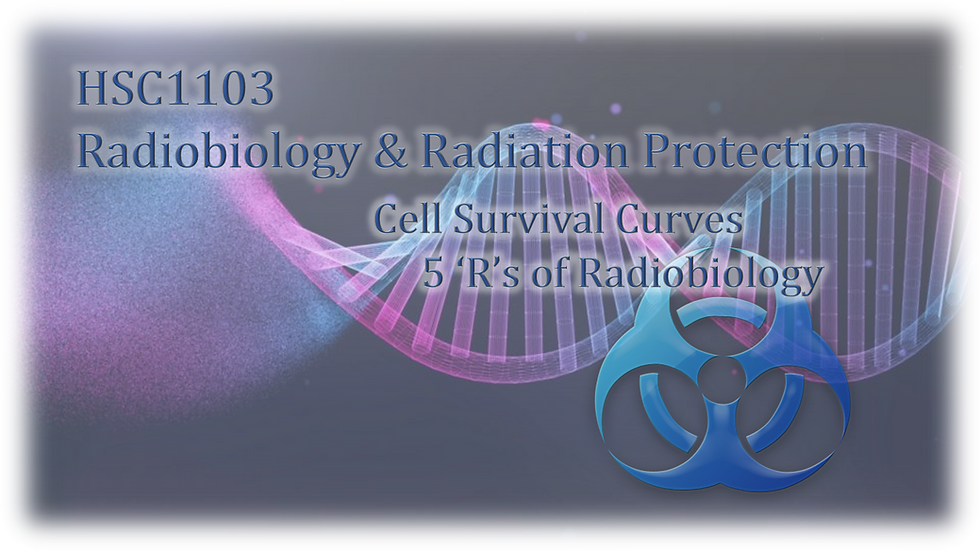
Survival Fraction (SF) is the proportion of cells that still retain the ability to proliferate after irradiation, relative to an unirradiated control population.
A logarithmic plot of SF against absorbed radiation dose produces a survival curve characterized by the parameter D_0 that determines radiosensitivity of the cells. This is the dose at which 36.8% of the irradiated cells survive, or the mean lethal dose.
The CS curve is plotted based on values obtained from irradiating cell cultures.

In an un-irradiated control dish, 100 (could have been any number) cells were seeded and incubated (allowed to grow) for 7 days before being stained and observed. The fraction of the colonies remaining is known as the plating efficiency.
Due to suboptimal growth medium and errors and uncertainty in counting the cell suspension, plating efficiency is rarely 100%.
2000 cells are seeded, and then exposed to 8Gy of x-rays. 32 colonies were counted post-irradiation. Accounting for plating efficiency, which takes into account the percentage of cells which would have died anyway, the survival fraction can be calculated.

A CS curve allows us to compare the radiosensitivities of two or more cell types. It is worth noting that survival date obtained under controlled laboratory in vitro conditions may vary from in-vivo conditions.
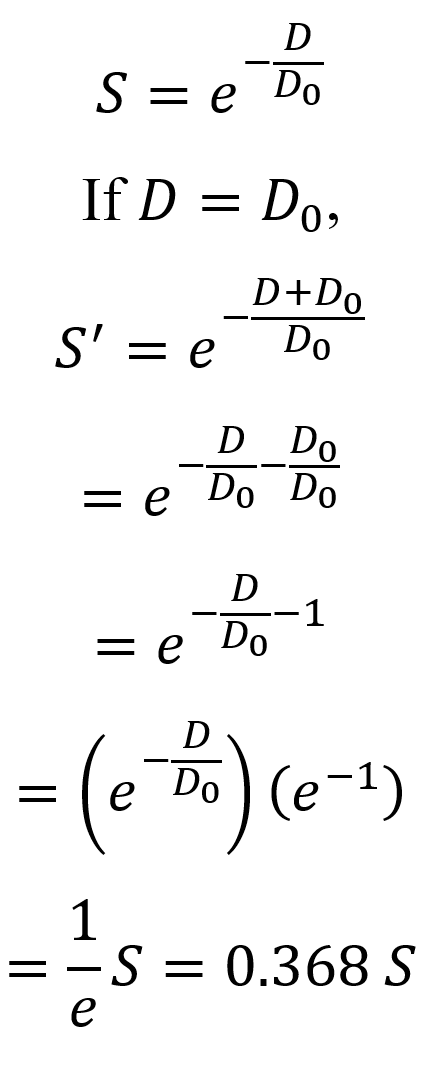
At the threshold dose where the CS curve turns downward, it follows a linear slope, the steepness of which indicates the relative sensitivity of the cells to radiation.
In this case, curve A has a steeper slope and drops off more quickly as radiation increases, indicating a higher rate of decline for the survival of endothelial cells. This shows that endothelial cells are more radio-sensitive compared to epithelial skin cells, as shown in curve B.
Several factors will affect the shape of the CS curve:
Dose rate
Oxygen level
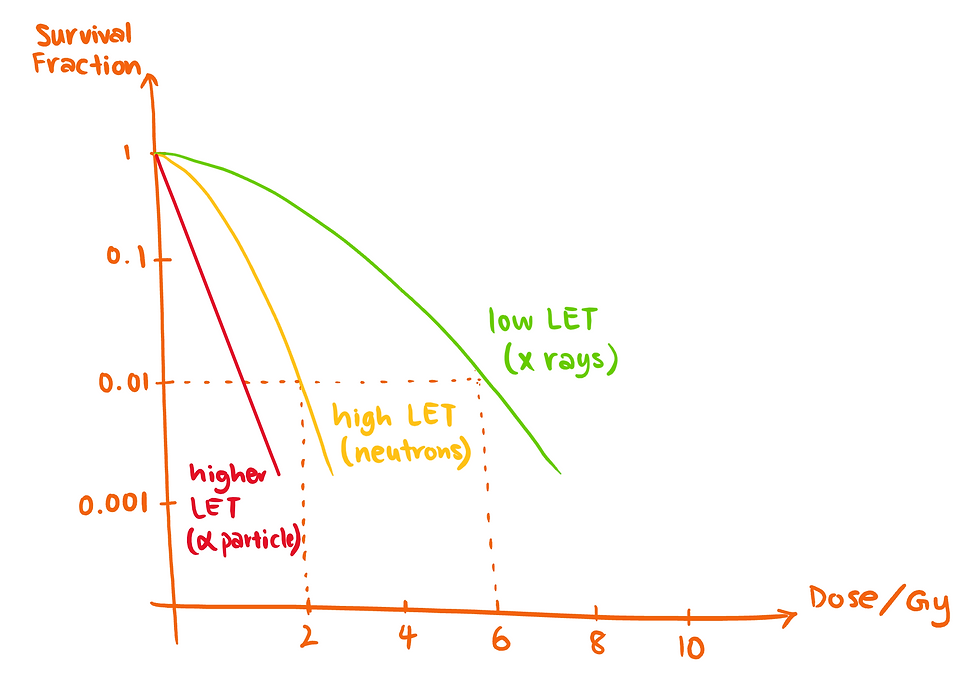
LET of incoming radiation
Fractionation schedule
Position in cell cycle
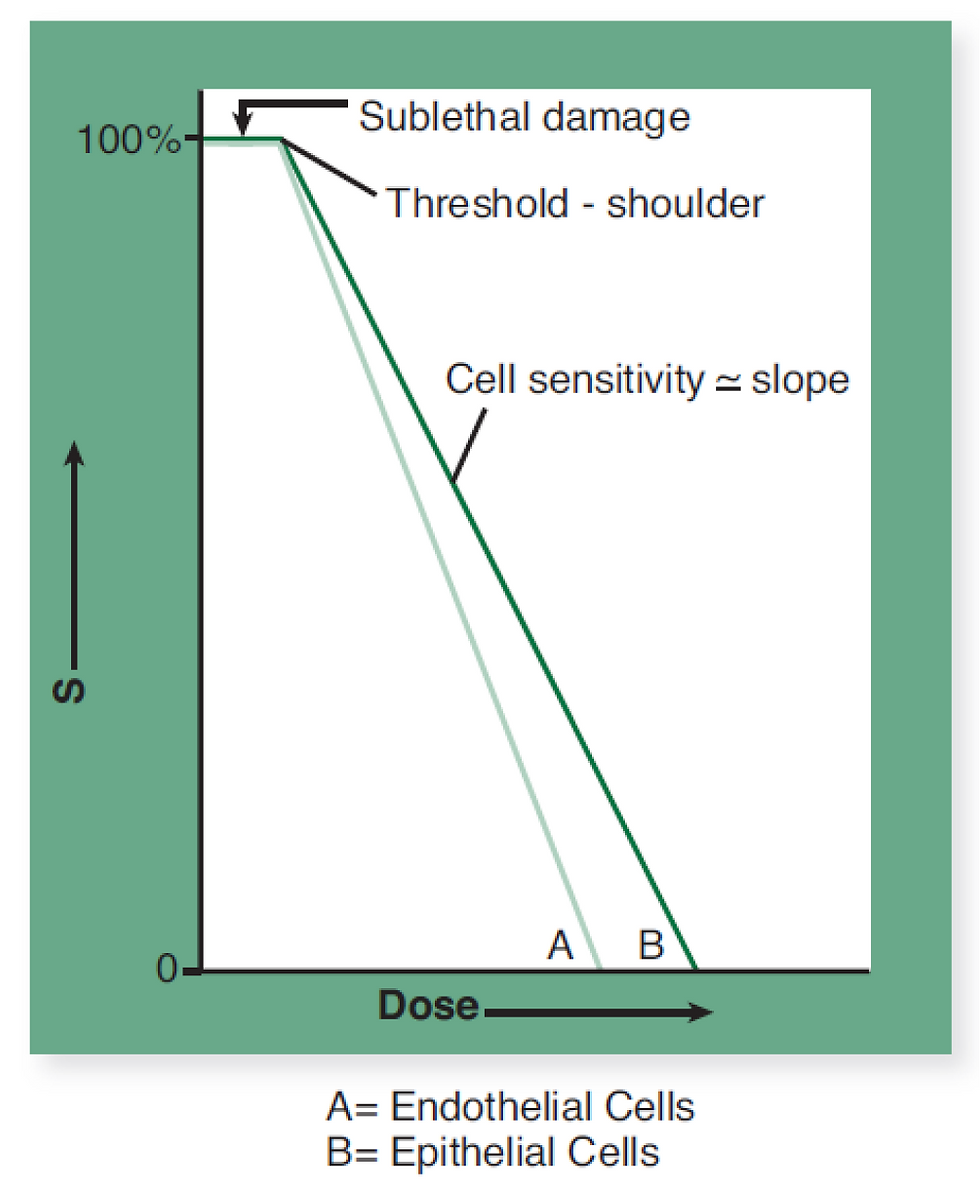
A higher dose rate would lead to a steeper decrease in the CS curve:
Aerobic conditions produce a steeper decrease in the CS curve, allowing lower doses to achieve the same extent of cell kill:

Radiation with higher LET will produce a steeper decrease in the CS curve.
Fractionating a dose has severe influences in the CS curve:

Curve A represents one fraction of 10Gy. Curve F represents the same total dose as in curve A delivered in equal fractionated doses (D_1 through D_5) of 2Gy each, with intervals between fractions sufficient to allow for repair of sublethal damage.
The position of the cell in the cell cycle also affects the CS curve.
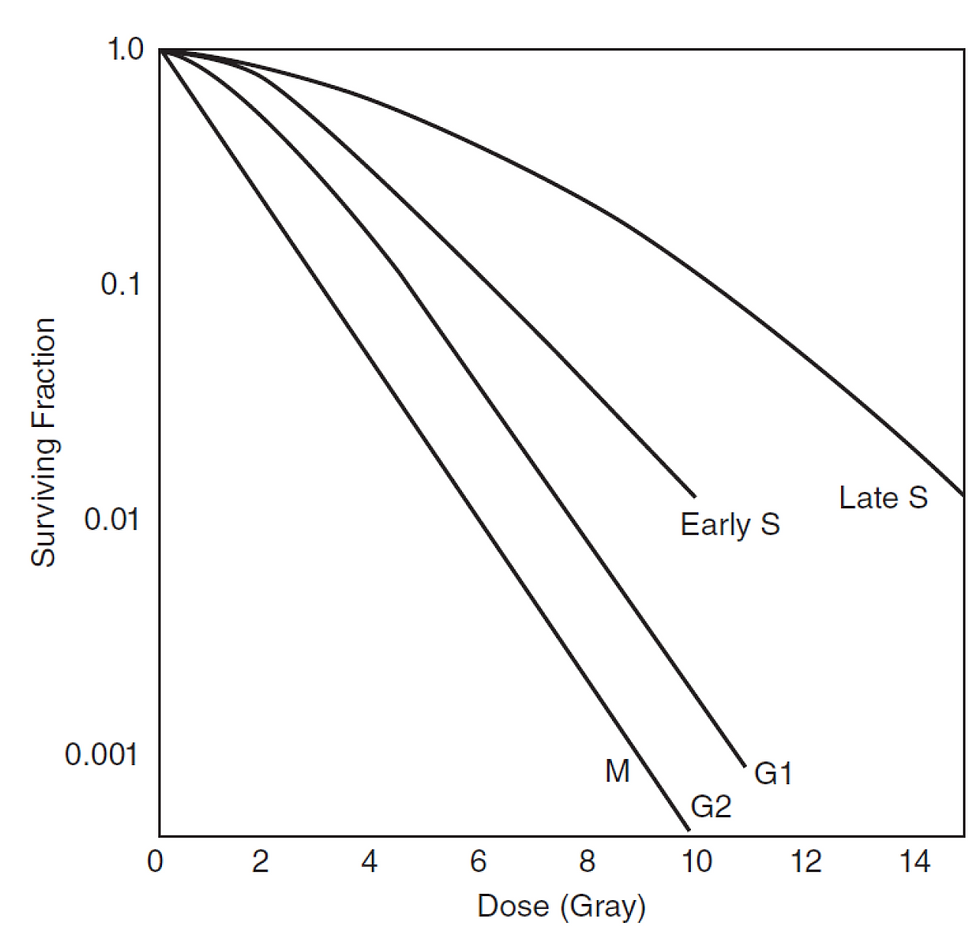
Mitosis and G2 phases are the most radiosensitive, followed by G1 phase and S phase. S to G2 phase is the least radiosensitive.
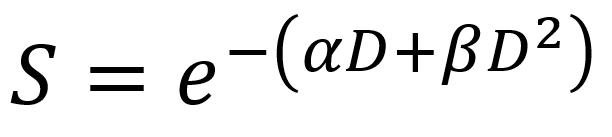
While the multi-target model is reliable at high doses, the low dose / shoulder region experiences inaccuracies, and hence a linear quadratic model (LQM) has been developed to accurately describe the CS at low dose / shoulder region.
The quadratic component, β is important because it takes into account the cells that can repair the damage after a single hit of radiation. This component is particularly important for low-LET radiation.
The linear component, α is important because it takes into account the cells that cannot repair themselves after a single hit of radiation. α is also important in high-LET radiation.
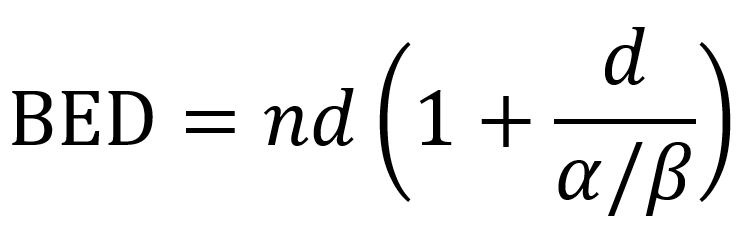
The Biological Effective Dose, or BED, is calculated as such:
The LQM is useful because:
Equivalent fractionation schemes can be formulated
Unintentional breaks in radiation therapy treatment require additional, compensatory doses, and these can be calculated
Acute and late responses
It is worth noting that the reliability of the BED formulation decreases in fraction doses of more than 3Gy.
The 5 ‘R’s of Radiobiology
Radiosensitivity – Intrinsic radiosensitivity differs between cells of tumours and normal tissue types. Curative dose is proportional to the log of cell number.
Repair – Cells differ in their capacity to repair DNA damage, particularly after a small dose of radiation. Repair is usually more effective in non-proliferating, somatic cells. The repair process takes at least 6 hours to complete. Repair is maximal in late-responding tissues given small fractions. Hyperfractionation may be advantageous. Treatments need to be well separated in order to avoid compromising repair.
Repopulation – Surviving cells in many tumours and in acute responding normal tissues proliferate faster once treatment is in progress. This means that shortened treatment times (accelerated therapy) may be advantageous for some tumours. Acute effects may be slightly increased. Gaps should be avoided.
Reoxygentation – Hypoxic tumour cells are relatively resistant to radiation. Hypoxic surviving cells reoxygenate, becoming radiosensitive, as treatment proceeds. This means that very short treatment times could lead to resistance due to persistence of hypoxic cells. Treatment of anemia is essential in order to optimize tumour response.
Redistribution – Cells in certain phases of the proliferative cycle, like late synthesis phase, are relatively resistant and survive preferentially. With time in between fractions, cells redistribute themselves over all phases of the cell cycle. Closely spaced treatment fractions could lead to resistance due to persistence of cells in less sensitive phases.


Comments